No worries, Mate!
My wife and I enjoyed a fine day in the Blue Mountains outside Sydney the other day, led by a happy-go-lucky Aussie named Justin (“think Timberlake, not Bieber” he admonished). All went well until we went to pick up another American couple who took the option of a walk-about along the Grand Canyon (not quite like the one in USA, this one being a bit shallower and filled with gum trees, but impressive nonetheless). They’d been set off with a “no worries, Mate” when the fellow asked for directions. “Just follow the one-and-only trail until you get to the trail-point labelled ‘Leap’,” said Justin. When the intrepid trekkers failed to show, our guide sang a different tune. “I’m going to have to fill out an awful lot of paperwork,” he kept lamenting as we sat around for some hours hoping to hear from the missing hikers.
Eventually they were located, having taken a wrong turn on the supposedly forkless path.
At times like this I am happy to have my worry stone to roll around my fingers. I picked up a new one this trip at an aboriginal culture center. It is a river rock picked up as a “dreaming stone” by a native Australian whose wife painted it with a colorful kangaroo—a symbol of strength. That’s just what I need in times when things go kerflooey such as the Bieberesque moment that Justin endured.

“The hand can operate as a director of consciousness—a tool or agent for the mind in achieving a mental state in which people will be able to get the outcome they want.”
– Frank R. Wilson, neurologist (quote reported by Sue Shellenbarger of Wall Street Journal in a report this week on the mental value of “clicking, stretching, twirling, flipping, squeezing or fiddling with everyday objects”).
So long as I have a worry (or dream) stone there can be no great worries, other than one big one–it going missing. I worry about that night and day.
Null hypothesis significance testing procedure (NHTSP) psyched out
My colleague Brooks Henderson alerted me to this new policy by the editors of the Basic and Applied Psychology (BASP) journal to ban the NHSTP. According to the editorial in their Feb 2015 issue, authors must remove all p-values and the like and not refer to “significant” differences. They also banned confidence intervals, which really makes this new policy onerous, in my opinion.
I do see the sense of focusing on effect sizes and allowing the readers, presumably subject matter experts, to judge their importance. However, although they do “encourage the the use of larger sample sizes”, it makes no sense, I feel, to disregard the impact of small studies on the uncertainty of the results.
Blaming the misuse of NHTSP and p-values in particular for bad science is like letting a bad guy go by saying the gun is at fault.
Are dogs right-pawed or left?
Last week I judged a number of entrants in a 7th grade science fair. The one I liked the best investigated a number of dogs to see which paw they favored. This depended on which hand the student held out. When he held out his left hand, all dogs offered up their right paw. But when he held out his right hand, half of the canines shook it with their left paw. I conclude from this that far more dogs are lefties than humans, who favor their right hand by a ratio of 9-to-1. Based on what I read here in the Washington Post and see published on the internet, my guess is that dogs are split 50/50 left versus right. The same may be true for cats, although they might be slightly more likely to right-pawed according a study noted in the Post article.
Just for fun, test your pet by putting a snack just barely within their reach. Which paw do they put out? Make a note. Do it again a number of times. If you see what seems to be a significant bias to left or right, let me know.
Lightening up the load on birds and bees
My former neighbor Phil–a bee-keeper–told me he loaded up too many hives in his truck on a run to California and it went over-weight for the regulations on the road home. However, Phil beat the highway inspectors by banging on the side with a hammer as he drove onto the scale. The bees flew up in the air and took down the measurement just enough for a pass–avoiding a hefty fine.
I always wondered if Phil was ‘bee-essing’ me, but a recent study by a Stanford scientist, reported here by NewScientist, indicates that this trick might be bang on. The only catches are that the flyers (in this case Pacific parrotlets, must flap in synch and the weight must be taken on the upstroke. This whole idea would backfire badly on the downstroke when the weight of the flyers comes back double.
Bee-leave it or not.
Picking on P in these times of measles
Posted by mark in science, Uncategorized on February 3, 2015

Randall Munroe takes a poke at over-valuers of p in this XKCD cartoon
Nature weighed in with their shots against scientists who misuse P values in this February 2014 article by statistics professor Regina Nuzzo. She bemoans the data dredgers who come up with attention-getting counterintuitive results using the widely-accepted 0.05 P filter on long-shot hypotheses. A prime example is the finding by three University of Virginia finding that moderates literally perceived the shades of gray more accurately than extremists on the left and right (P=0.01). As they admirably admitted in this follow up report on Restructuring Incentives and Practices to Promote Truth Over Publishability, this controversial effect evaporated upon replication. This chart on probable cause reveals that these significance chasers produce results with a false-positive rate of near 90%!
Nuzzo lays out a number of proposals to put a damper on overly-confident reports on purported scientific studies. I like the preregistered replication standard developed by Andrew Gelman of Columbia University, which he noted in this article on The Statistical Crisis in Science in the November-December issue of American Scientist. This leaves scientists free to pursue potential breakthroughs at early stages when data remain sketchy, while subjecting them to rigorous standards further on—prior to publication.
“The irony is that when UK statistician Ronald Fisher introduced the P value in the 1920s, he did not mean it to be a definitive test. He intended it simply as an informal way to judge whether evidence was significant in the old-fashioned sense: worthy of a second look.”
Statistic of the year: Americans busy buttering up
Posted by mark in pop, Uncategorized on December 31, 2014
According to today’s Wall Street Journal, USA citizens on average consumed 24 sticks of butter in 2014. Wisconsinites would be careful to differentiate whether this was really “butter” or actually “oleo”—aka margarine. By State law* restaurants will only serve the non-dairy “yellow stick from Satan himself” (as a Governor deemed it) if a customer specifically orders it. Until 1967 margarine was not allowed to be sold at all in Wisconsin—it had to be smuggled in from Illinois. Meanwhile in Minnesota only sickly white oleo could be purchased. To make it look buttery consumers had to knead in a capsule of yellow food color. I remember those days and my wife Karen recalls going on smuggling runs for pre-yellowed margarine from Iowa. Those were some messed up times!
Butter, preferably from grass-fed cows (margarine being ‘udderly’ eschewed), is now the rage as a health food thanks to The Cult of the Bulletproof Coffee Diet. At up to 2 tablespoons of this bovine grease per cup I presume 2015 will see an increase in per capita consumption. Yuk! These are some messed up times!
*See this detailed along with other strange Wisconsin State laws here.
The best accidental inventions of all time
I learned from my latest issue of Chemical and Engineering News that Stanley Stookey of Corning Glass Works died last month at age 99. In 1952 he mistakenly heated an alumino-silicate glass to 900 degrees C meaning only to top out at 600. After much cursing, according to the CEN story, Stookey found that instead of the molten mess expected, the material crystallized into a new type of material called a glass ceramic that proved to be “harder than carbon steel yet lighter than aluminum—shatterproof.”
Being in the business of planned experimentation it always amazes me to come across stories like this of serendipitous science. Obviously chance favors the prepared mind because most of the momentous discoveries are made by world-class chemists such as Stookey and others of his kind in the fields of physics and so forth.
I am a huge fan of 3M Post-It® Notes, not only due to their incredible usefulness, but also because it delights me to think of my fellow Minnesotan Art Fry coming up these by accident. For a list including him and a dozen other experts in their field who made the most of mishaps into inventions see 13 Accidental Inventions That Changed The World by Drake Baer of Business Insider. The one I like best is George Crum (great surname for a chef!) who reacted to customer complaining about his French fries by slicing them into ridiculously thin and hard-backed pieces. Never mind that it probably was his sister Katie who made the accidental discovery according to this Snopes investigation. Either way this works out to be a delicious story.
My advice to our clients is to keep a close watch for any strange results that crop up as statistically deviant in the course of a designed experiment. They may turn out to be really Crummy!
Fewer fatalities but not skidding fast enough
It always surprises me how the same stats create completely opposite reactions. For example as I was reading Wall Street Journal’s breakdown of “Safety Gains” and feeling good about it my wife exclaimed at seeing “Traffic Deaths Fall” in Saint Paul Pioneer Press that she could not believe that over 30,000 Americans died in 2013 from car crashes. I suppose the differing headlines were the main cause for the dissonance because after looking at the data her way I had to agree that it does remain appalling. WSJ homes in on a big drop in deaths of those driving new cars to 3.4 per 100,000 automobiles built in 2013—a third less than new vehicles in 2008. US Transportation Secretary attributes this largely to better stability controls that prevent cars from overturning.
On a related note, CarInsuranceComparison.com just came out with their latest Worst Drivers by State map. See here how Minnesota stands out in glorious green as the safest steerers in the whole country. Our main threat comes from roustabouts in Montana (tied for 1st of the worst states for bad drivers) barreling in from the east and convoying with the fellow fracking North Dakotans (4th on the hit list) for a blowout in the Twin Cities.
Buckle up, keep an eye out and drive carefully over the holidays so you do not add to the 2014 statistics. Also, ask Santa for a new car. That is your safest bet.
Pianogram of Piano Man
With its bizarre German-captioned photo of a full shopping cart cut in half, this literally off-the-wall Flowing Data blog on physical infographics got me going on displaying data using apropos figures or objects.
Just to show that it’s not just das deutchlanders who apply figures in clever ways see the clever “colour” matching guide inside this suckUKtm (!) tea mug.
Further internet-searching on “infographics” brought me to these intriguing ‘pianograms’ including one, appropriately enough, of Piano Man by Billy Joel.
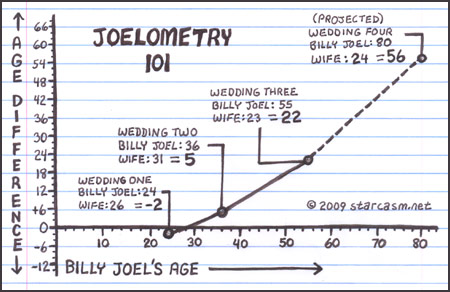
P.S. Coincidentally Billy Joel (not my cup of tea) just announced yesterday his return to Minneapolis for a concert, despite swearing off any further touring. Check out a wicked Starcastic graph of his many marriages and their progression toward younger and younger women. Then, to be fair, see this story about how Billy Joel’s three wives stole his heart and his money.
Choropleth maps—say what?
The mating of maps with statistics goes back to this 1826 graphic by mathematician Charles Dupin that illustrated the extent of illiteracy in France via regional shadings. Later these thematic plots came to be known as a “choropleth”—from the Greek for region (choro) and multitude (pleth). I only heard of this term this week, thanks to a Flowing Data blog by Nathan Yau with a tip on how to produce choropleth maps online.
Another variation on thematic maps is the “cartogram”—for example this one published yesterday by the Wall Street Journal that illustrates American unemployment. A cartogram shifts shapes so their areas correlate to some measure, in this case the relative density and number of workers. I am pleased to see on the last of the three figures that my home state of Minnesota fared well with its recovery from the Great Recession. However, I don’t like seeing our outline distorted so. The Dakotas and neighboring states really got squeezed. Perhaps we get some oil out of it to make our economy even better. ; )